Severe Accident Model
Micro-Simulation Technology
Revised January 2008
Introduction
We have successfully expanded the PCTRAN model of GE BWR5 to cover
severe accidents. A severe accident is defined as one beyond
design-basis with significant core damage and containment failure.
A borderline is usually set in probability safety assessment (PSA)
as Division 2 at the top-of-active fuel (TAF) uncovery, and
Division 3 for fission product relocation. Our previous models
have covered core heatup and hydrogen generation by metal-water
reaction. For BWR's with inerted containment, hydrogen burn is
not possible. But leakage pathways through the containment system
may release significant radiological material to the atmosphere.
It is important to simulate these phenomena for training and
emergency planning. Download
Core Model
The core is modeled into six vertical nodes. Each one generates a
portion of the decay heat after shutdown. When the boundary heat
removal rate is less than the core heat, the core node is heated
up to the point of melting. Molten fuel may collapse into the
bottom of the vessel. The vessel lower head may then heat up to
the melting point, too. The molten debris may drop into the
drywell cavity floor. During the fuel damage process, first the
fission gas in the clad may leak out. Later if the fuel and
cladding continue their degradation, fuel isotopes will release
also. In addition to iodine and noble gases, there are alkali
metals, tellurium, barium, cerium, lanthanides, etc. The elevated
concentration of these radioactive isotopes would find their ways
through the vessel break, relief valves, and containment leakage
into the environment.
PCTRAN core model
PCTRAN BWR5 plant mimic with Mark II containment
Verification Runs
There are basically two types of severe accidents: 1) low reactor
pressure starting from a loss-of coolant accident (LOCA) and 2)
high pressure starting from reactor isolation; reactor scram was
assumed successful for both. Part of all ECCS must be assumed to
be lost or the consequence would not be severe enough to expose
the core. The third kind is anticipated transient without scram
(ATWS). That will be analyzed separately later.
1. LOCA
In conducting a test run, you can initiate a large break LOCA,
e.g. 2000 cm2 recirculation loop break for the BWR. With
continued feedwater and automated initiation of ECCS, the core
will soon be reflooded and no significant clad damage is expected.
So we purposely disable the feedwater and all ECCS trains. For
BWR5 there are HPCS, RCIC, LPCS and RHR in the LPCI mode. We
disable them all by either tripping the respective pumps or
closing the isolation valves.
The water level in the vessel then drops rapidly and soon exposes
the fuel. You should click the "View" button in the top menu bar
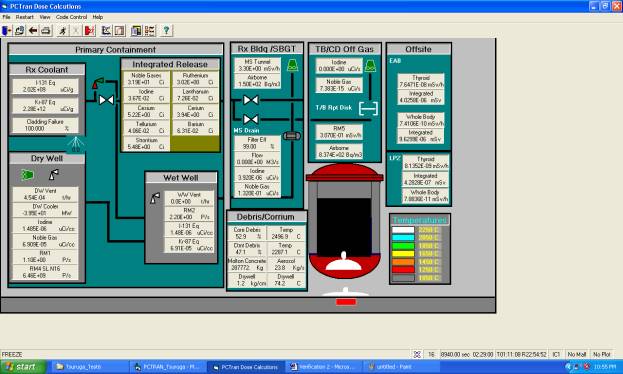
and choose "Dose mimic". Following is a display at about 3600
seconds after the break - the point of initial core-melt of the
BWR.
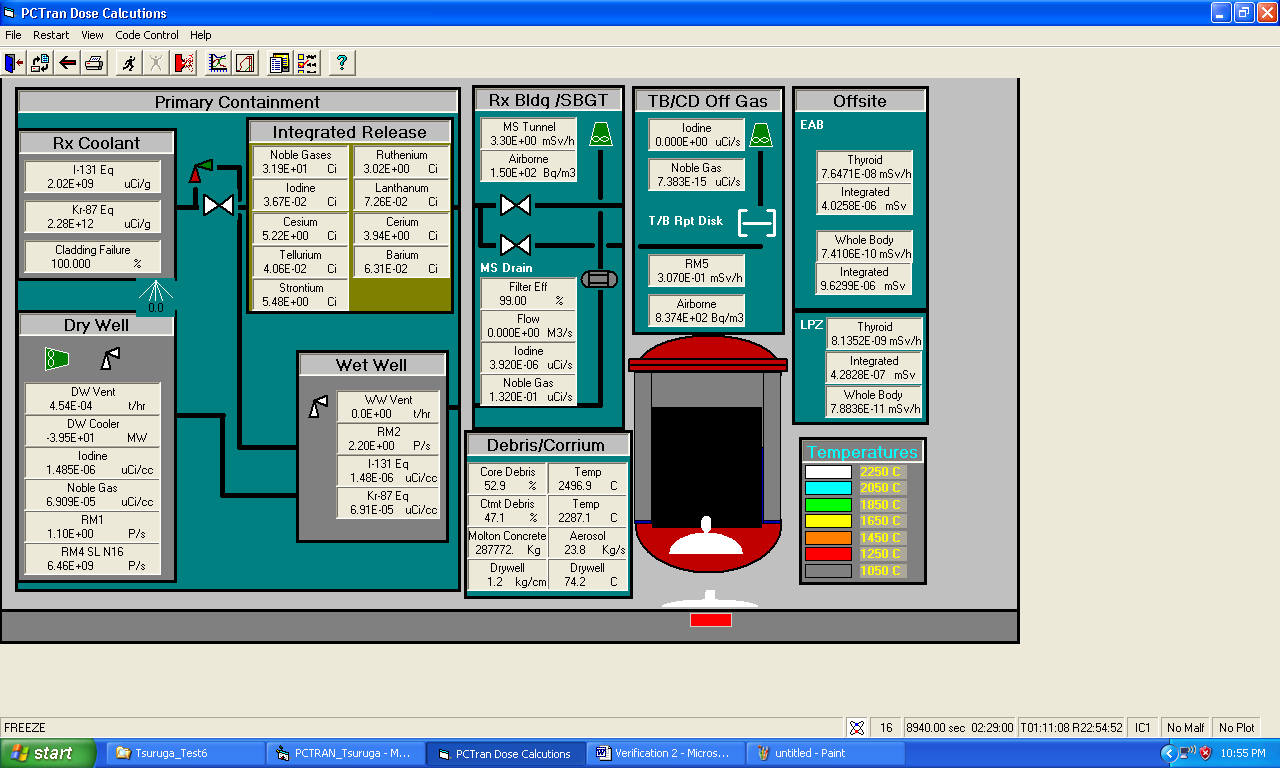
PCTRAN Dose Mimic at Core-melt Start Following a LBLOCA Without ECCS
Since core-melt is usually a slow process, you can click on the
fast time speed multiple to accelerate the run. If it is still
too long a wait to reach advanced stage of severe damage, you can
click at the "Restart" button in the menu bar and select one of
the previously saved IC's. Resume the run at that point you can
verify the core node temperatures, extent of clad damage,
radiation monitor readings and fission product release source
terms. You can check the key variables' trending by going to
"View", "Transient Plot" as before. The integrated release of
iodine, noble gases, and heavy elements are shown in the panel
inside Reactor Building. Major pathways are through the primary
containment leakage, drywell and wetwell vents, MSIV and bypass to
the low-pressure turbine rupture disk, the standby gas treatment
system (SGTS) in the Reactor Building, etc. A further
introduction of malfunction in anyone of these will aggregate the
release and instantly reflected in the source terms. Using the
dispersion factors X/Q from the plant's Final Safety Analysis
Report (FSAR), the projected doses at the site Exclusive Area
Boundary (EAB) and Low Population Zone (LPZ) are displayed.
Further melting without ECCS water will lead core collapse to the
vessel bottom. Shown below at about 6300 seconds is a diagram as
the core collapsed. The vessel bottom steel is then heated up to
melt, too. Debris is then dropped on to the drywell floor.
If the emergency power is resumed, e.g. the drywell spray is
available and turned on by the operator, it will immediately cool
the debris as shown by changed color from white (over 2250C) to
gray (under 900C).
Core-Concrete Interaction Model
In the event that the molten core heats up the vessel bottom and melts through it, the debris falls into the reactor cavity (drywell pedestal for BWR). It is called corium as the metal interacts with concrete and form a slump. At lower temperatures, degassing of concrete occurs and both steam and carbon dioxide can be released. At higher temperatures concrete can also be melt and mixed with metals. Since concrete is normally formed by Ca, Fe, Si, Al, Na, Mg, Mn, Cr, etc. with variable compositions. Typical fractions are:
Mass fraction of concrete |
Component |
0.3288 |
|
CaO |
0.357 |
|
SiO2 |
0.067 |
|
Al2O3 |
0.0533 |
|
H2O |
0.1939 |
|
CO2 |
The most important reactions are:
Fe + CO2 -> FeO + CO + Q1
Fe + H2O-> FeO + H2 + Q2
Ni + H2O -> NiO + H2 + Q3
Zr + H2O -> ZrO2 + H2 + Q4
2 Cr + 3 H2O -> Cr 2O3 + 3 H2 + Q5
Each reaction rate is temperature-dependent and given by the parabolic law:
K = R5 exp (-G/T) (kg/M2)2/sec, T in Kelvin
To keep track of every reaction is too tedious for a simplified code. Therefore we lump all them together into a single form similar to the above Zr-H2O or Zr-O2 equations. Leaving the reaction rate and exothermal heat as typical values for adjustment.
In the core Zr-water reaction calculation, cylindrical geometry has been used for vertical tube bundle configuration. For CCI it is instead a semi-hemisphere configuration to represent the slump pile of debris. The top hemisphere interacts with atmosphere above, and the bottom flat surface interacts with concrete floor. A red slab represents the molten pool of concrete in the mimic display. Following are dose mimics for BWR and PWR plants respectively.
Vessel Penetration with Debris in the Drywell Floor
The concrete penetration depth is limited by the corium temperature decrease during a transient. As soon as the corium temperature is reduced to below the reaction threshold temperature, the reaction is stopped. Another limit is the total amount of core mass. As soon as the whole core dropped into the containment has completely reacted with concrete, no further actions are possible. Whichever comes first will stop further propagation of CCI. Heat generation by CCI is not explicitly displayed or tracked as an output variable, since there is no way to be verified or benchmarked against experimental or other code predictions.
Verification Runs
There are basically two types of severe accidents: 1) low reactor pressure starting from a loss-of coolant accident (LOCA) and 2) high pressure starting from reactor isolation; reactor scram was assumed successful for both. Part of all ECCS must be assumed to be lost or the consequence would not be severe enough to expose the core. The third kind is anticipated transient without scram (ATWS). That will be analyzed separately later.
1 LOCA
In conducting a test run, you can initiate a large break LOCA, e.g. 2000 cm2 recirculation loop break for the BWR. With continued feedwater and automated initiation of ECCS, the core will soon be reflooded and no significant clad damage is expected. So we purposely disable the feedwater and all ECCS trains. For BWR5 there are HPCS, RCIC, LPCS and RHR in the LPCI mode. We disable them all by either tripping the respective pumps or closing the isolation valves.
The water level in the vessel then drops rapidly and soon exposes the fuel. You should click the “View” button in the top menu bar and choose “Dose mimic”. Following is a display at about 3600 seconds after the break - the point of initial core-melt of the BWR.
Since core-melt is usually a slow process, you can click on the fast time speed multiple to accelerate the run. If it is still too long a wait to reach advanced stage of severe damage, you can click at the “Restart” button in the menu bar and select one of the previously saved IC’s. Resume the run at that point you can verify the core node temperatures, extent of clad damage, radiation monitor readings and fission product release source terms. You can check the key variables’ trending by going to “View”, “Transient Plot” as before. The integrated release of iodine, noble gases, and heavy elements are shown in the panel inside Reactor Building. Major pathways are through the primary containment leakage, drywell and wetwell vents, MSIV and bypass to the low-pressure turbine rupture disk, the standby gas treatment system (SGTS) in the Reactor Building, etc. A further introduction of malfunction in anyone of these will aggregate the release and instantly reflected in the source terms. Using the dispersion factors X/Q from the plant’s Final Safety Analysis Report (FSAR), the projected doses at the site Exclusive Area Boundary (EAB) and Low Population Zone (LPZ) are displayed.
Further melting without ECCS water will lead core collapse to the vessel bottom. Shown below at about 6300 seconds is a diagram as the core collapsed. The vessel bottom steel is then heated up to melt, too. Debris is then dropped on to the drywell floor.
If the emergency power is resumed, e.g. the drywell spray is available and turned on by the operator, it will immediately cool the debris as shown by changed color from white (over 2250°C) to gray (under 900°C).
Micro-Simulation Technology is currently working on a model for debris-concrete-interaction (CCI). The interaction will generate further heat and aerosols that may also get released into the atmosphere.
At end of a run, you can check “yes” if you want data of operations and dose release saved. A new database DoseData.mdb is generated that can be directly used by dose projection codes for area dose projection. A sample table is listed below.
Radiological Release Source Terms in Curies versus Time in Seconds
TIME I N.G. Ce Te Sr Ru La Ce Ba
8940 1.05E+03 1.33E+05 0.00E+00 0.00E+00 0.00E+00 0.00E+00 0.00E+00 0.00E+00 0.00E+0
9000 1.06E+03 1.34E+05 0.00E+00 0.00E+00 0.00E+00 0.00E+00 0.00E+00 0.00E+00 0.00E+0
9060 1.06E+03 1.34E+05 0.00E+00 0.00E+00 0.00E+00 0.00E+00 0.00E+00 0.00E+00 0.00E+0
9120 1.09E+03 1.36E+05 9.98E+02 1.56E-01 0.00E+00 2.29E-02 1.26E-03 8.37E-03 3.64E-0
The tabulated data is stored in either Excel or Access form and available for printing and/or plotting during an exercise. This data can easily be fed into any real-time meteorological dispersion software for dose projection.
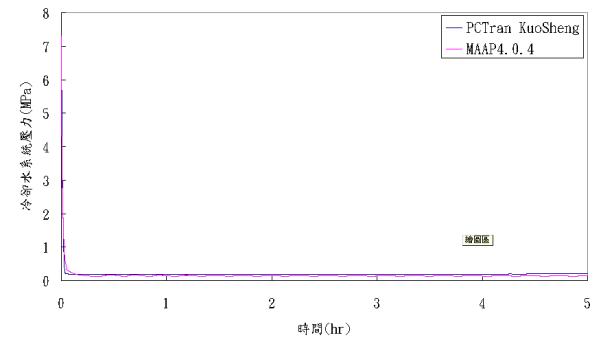
Fig. Large Break LOCA Reactor Pressure (Mpa) vs. Time (hr)
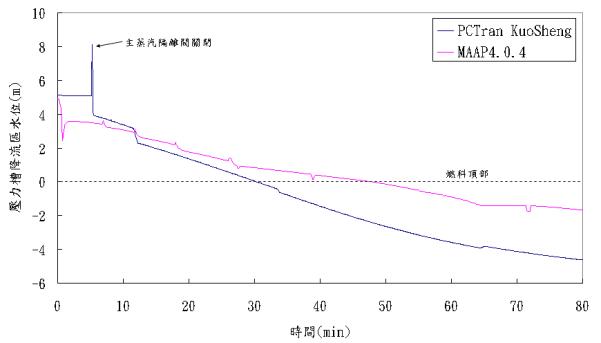 Fig. Small Break LOCA Reactor Vessel Level (m TAF) vs Time (minutes) Fig. Small Break LOCA Reactor Vessel Level (m TAF) vs Time (minutes)
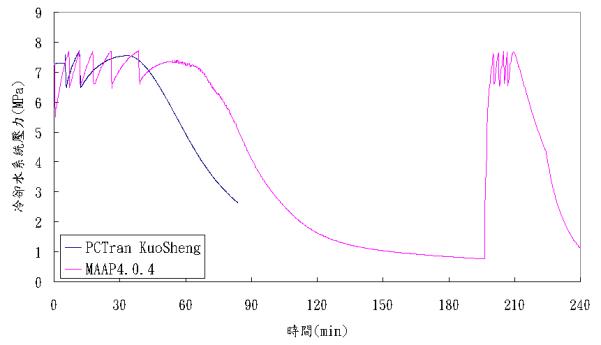
Fig. SBLOCA Reactor Dome Pressure (Mpa) vs. Time (min)
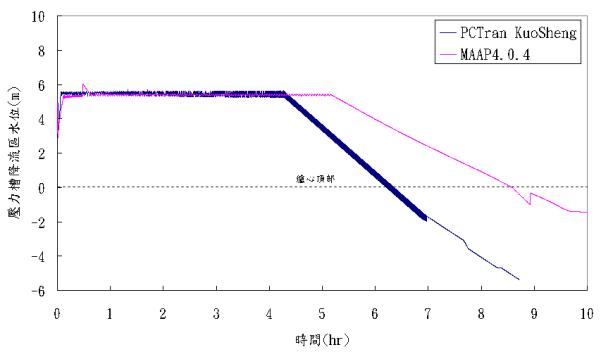
Fig. Mid-size LOCA Reactor Vessel Water Level (m TAF) vs. Time (hr)
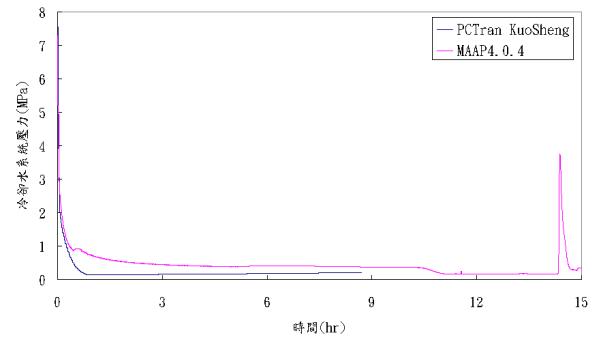
Fig. Mid-size LOCA Reactor Vessel Pressure (MPa) vs. Time (hr)
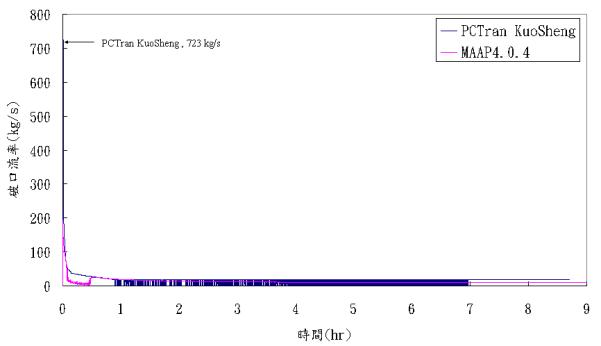
Fig. Mid-size LOCA Break Flow (kg/s) vs. Time (hr)
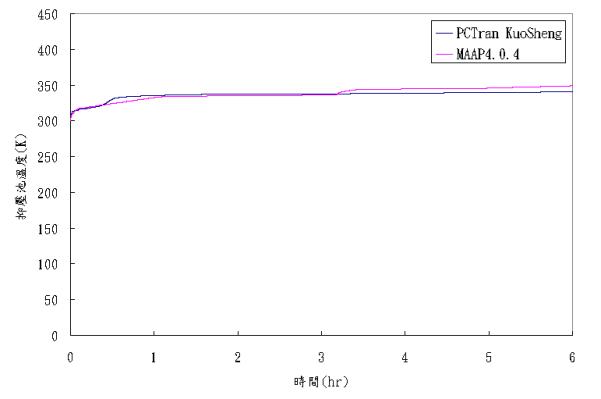
Fig. Suppression pool water temperature (K) after ATWS (hours)
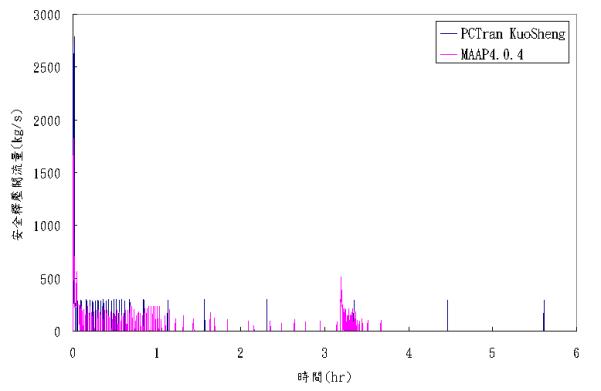
Fig. SRV flow vs. time (hr) after ATWS
Resumption of Containment Spray to Quench the Debris
At end of a run, you can check "yes" if you want data of
operations and dose release saved. A new database DoseData.mdb is
generated that can be directly used by dose projection codes for
area dose projection. A sample table is listed below.
Radiological Release Source Terms in Curies versus Time in Seconds
| TIME | I | N.G. | Ce | Te | Sr | Ru | La | Ce | Ba |
| 8940 | 1.05E+03 | 1.33E+05 | 0.00E+00 | 0.00E+00 | 0.00E+00 | 0.00E+00 | 0.00E+00 | 0.00E+00 | 0.00E+0 |
| 9000 | 1.06E+03 | 1.34E+05 | 0.00E+00 | 0.00E+00 | 0.00E+00 | 0.00E+00 | 0.00E+00 | 0.00E+00 | 0.00E+0 |
| 9060 | 1.06E+03 | 1.34E+05 | 0.00E+00 | 0.00E+00 | 0.00E+00 | 0.00E+00 | 0.00E+00 | 0.00E+00 | 0.00E+0 |
| 9120 | 1.09E+03 | 1.36E+05 | 9.98E+02 | 1.56E-01 | 0.00E+00 | 2.29E-02 | 1.26E-03 | 8.37E-03 | 3.64E-0 |
The tabulated data is stored in either Excel or Access form and
available for printing and/or plotting during an exercise. This
data can easily be fed into any real-time meteorological
dispersion software for dose projection.
2. Reactor Isolation (High Pressure) Event
A station blackout event (SBO) will lead to reactor isolation at
high pressure. Without AC power the high pressure core spray
(HPCS), RHR pumps for LPCI and containment spray, and low pressure
core spray (LPCS) are all disabled. The only passive devise
available is the steam-driven reactor coolant isolation cooling
(RCIC) system. Since its low capacity it is not sufficient for
coolant loss through the cycling SRV's. In the following mimic we
started the transient by closing the MSIV and trip all feedwater
pumps. The reactor soon scrammed and the recirculation pumps are
tripped automatically. At reactor water dropped to L2 the high
pressure HPCS and RCIC started automatically. We disabled them
for simulating this event. Later when the water level dropped to
L1 the low pressure LPCI and Core Spray started. We also disabled
them.
Station Blackout
Steam relief into the suppression pool would heat up the pool
and pressurize the wetwell. As the wetwell pressure is greater
than that of the drywell by 0.035 bar, the vacuum breakers opened.
It is witnessed by the green breaker hinge swing open and turns
into red. So the drywell pressure also increased. When it
increased to the high DW pressure set point of 1.25 bar with the
reactor water level below L1, the Automatic Depressurization
System (ADS) started to open two sets of SRV's. This may not
happen since the RHR pumps were not available to refill the
vessel. Here we allowed ADS to depressurize the vessel.
After that the transient is similar to that of LOCA with core
heatup, meltdown, vessel penetration and debris falling into the
drywell. The containment continued to heat up until eventual
failure.
Shown below are transient plots of reactor pressure, drywell and
wetwell pressures, water level in the core, and peak fuel, clad
and water temperatures. They are all reasonable as expected for
the SBO event. They are also consistent with predictions from
other methodologies such as NUREG 1150 and MAAP code.
Conclusion
Since every BWR5 plant is highly plant specific, especially in the
release pathways and radiation monitoring system. MST is
experienced to model them as soon as a specific plant's layout and
data are available. The simulation prediction will then be
verified against other severe accident predictions. Since a
real-life severe accident has hardly ever happened, usually there
are two sources of data: 1) the Vendor's (GE/Hitachi/Toshiba)
Owner's Group Severe Accident Management Guidelines (SAMG), and 2)
MAAP or MELCOR computer runs. MST will conduct benchmark runs
against these two and ensure adequate prediction is resulted.
In summary, the severe accident capability expands PCTRAN
immensely to cover the worst possible scenarios. The generated
radiological release provides the source term for environment dose
projection. Using this tool to thoroughly investigate the possible
failure paths, you can develop the most effective mitigating
procedures. It is the ultimate tool for plant safety and
protection.
|